
جدول المحتويات
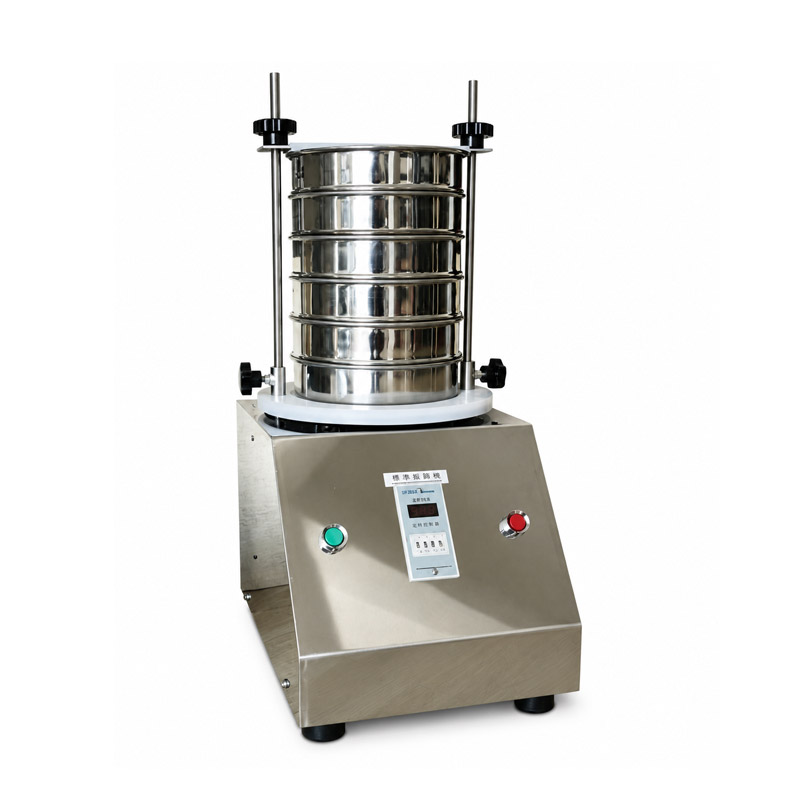
A lab sieve shaker helps describe how a sample is distributed across particle sizes. A stack of sieves is arranged with larger openings above smaller openings. After a controlled period of shaking, the material remaining on each sieve is weighed. Those masses show how much of the sample falls into each size interval.
The result is a description of the tested sample under the chosen method. It is not automatically a complete description of an entire truckload, storage pile, or production day. The sample collection and preparation matter just as much as the machine. Before looking at the neat percentages in a report, ask what material was taken, where it came from, and how it reached the sieve stack.
Read the stack from the top down
The upper sieve has the largest selected opening. It retains material that does not pass that opening under the test conditions. Material passing it reaches the next sieve, which has a smaller opening. The process continues down the stack until the smallest sieve and the collection pan underneath.
Suppose the selected openings are 2 millimeters, 1 millimeter, and 0.5 millimeters. Material retained on the 1-millimeter sieve has already passed the 2-millimeter sieve. It is therefore associated with the interval between those two boundaries, rather than being made entirely of particles exactly 1 millimeter across.
The pan collects material passing the smallest sieve in the stack. Its contents are not “zero size.” They are simply smaller, by the method's passage behavior, than the finest selected boundary. If a report labels the pan only as dust, that label may hide useful information about the actual lower limit of the test.
Weighing the sieve is not weighing the retained sample
Each clean, empty sieve has its own mass. The retained material is found by subtracting that empty mass from the combined mass after the test. Recording the tare correctly prevents a heavy sieve frame from being mistaken for a large fraction of coarse particles.
For example, an empty sieve weighing 425 grams and the same sieve plus retained material weighing 460 grams contain 35 grams of retained sample. The 460-gram combined value should not go directly into the percentage calculation. A report needs to keep tare mass and sample mass clearly separate.
Consistent identification is useful because two similar-looking sieves may not have identical empty masses. Labeling the sieve and recording its actual opening also helps avoid a stack being rebuilt in the wrong order. An apparently precise final calculation cannot repair an incorrectly identified sieve.
Work through one complete example
Take an illustrative 100-gram sample tested using the three openings above. After the test, 10 grams remains on the 2-millimeter sieve, 30 grams on the 1-millimeter sieve, 40 grams on the 0.5-millimeter sieve, and 20 grams in the pan. The recovered masses add to the original 100 grams.
Because the example begins with 100 grams, the retained percentages are numerically the same as those masses: 10, 30, 40, and 20 percent. With a 250-gram sample, the calculation would still divide each retained mass by the chosen starting mass and multiply by 100. The convenient 100-gram example should not be mistaken for a universal required sample size.
| Position | Retained mass | Percent retained | Cumulative percent passing |
|---|---|---|---|
| 2 mm sieve | 10 g | 10% | 90% |
| 1 mm sieve | 30 g | 30% | 60% |
| 0.5 mm sieve | 40 g | 40% | 20% |
| Pan | 20 g | 20% | Not an additional opening |
At the 1-millimeter boundary, 40 percent is cumulatively retained: the 10 percent on the upper sieve plus the 30 percent on that sieve. The remaining 60 percent has passed the 1-millimeter opening. “Percent retained” for one sieve and “cumulative percent retained” are different quantities.
Percent passing answers a different question
If you want to know how much material is finer than a selected boundary, percent passing is the useful value. If you want to know how much lies in a particular interval, the individual retained fraction is more useful. A reader can easily confuse these when a spreadsheet column is labeled only “percentage.”
In the example, 40 percent lies in the interval associated with passing 1 millimeter and remaining above 0.5 millimeters. But 60 percent passes 1 millimeter in total, because that total also includes the 20 percent reaching the pan. The two statements are both correct and describe different groups.
When comparing reports, check that they use the same boundaries and the same percentage definitions. Two numbers under an identically sized opening may represent retained and passing values, which move in opposite directions. Matching the number of decimal places does not make those columns comparable.
The mass balance catches simple mistakes
Add all recovered fractions, including material in the pan. Compare that sum with the initial prepared test mass using the tolerance required by the relevant method. A difference can come from spills, material left in a lid or brush, powder attached to equipment, weighing errors, or other handling effects.
Do not quietly force the recovered fractions to add to 100 percent without understanding the discrepancy. Normalizing values may be part of a defined method or reporting convention, but it should not conceal missing material. Fine material can be especially easy to lose during transfer, which would distort the apparent size distribution.
The reverse problem can happen too: recovered mass may exceed the starting mass because of contamination, a tare error, moisture gain, or a transcription mistake. A mass balance is a practical check on the handling and record, not proof that every other aspect of the test is correct.
Why the sample must represent the material
A pile of mixed sizes can segregate as it is poured or moved. Coarse grains may roll to one area while fines collect elsewhere. Taking a convenient scoop from the surface may therefore produce a sample that differs from the average composition of the whole pile.
The appropriate sampling and reduction method depends on the material and the relevant test procedure. The important learning point is that shaking cannot fix a biased sample. Repeating the test on the same biased scoop may produce consistent numbers while still missing the real distribution in the larger batch.
Record where and when the sample was collected, how it was reduced to test size, and whether it was dried or otherwise prepared. These details explain what the result means. Without them, a disagreement between two laboratories could come from different samples rather than different sieve shakers.
Longer shaking is not automatically a better test
Shaking helps particles find openings, but the test duration and motion should follow the applicable method. An overloaded sieve can limit the opportunity for particles to pass. Cohesive powder may form lumps, and fragile grains may break during prolonged handling. Extending the test indefinitely can therefore change the sample rather than merely improve separation.
A suitable endpoint or duration is part of the procedure, not an arbitrary preference for a larger passing percentage. If a result changes noticeably with extra shaking, investigate the method, loading, and material behavior. Do not select whichever duration produces the most attractive-looking distribution.
The sieve condition also matters. Damaged cloth can allow unexpectedly large material through. Blocked openings can retain fines. Cleaning and inspection should follow the sieve manufacturer's instructions so a brush or tool does not stretch, tear, or otherwise alter the screening surface.
Recognize what the test cannot tell you
Sieve analysis classifies material by passage through openings. It does not directly measure chemical identity, surface area, or every dimension of an irregular particle. A long thin particle may orient and pass differently from a round grain. Very fine or strongly cohesive powders may require another appropriate analysis method or a specified wet procedure.
This is why a sieve result should be described with its method rather than treated as a universal particle diameter measurement. It is still highly useful when the question is whether material passes defined openings under consistent conditions. Its strength is the clear connection between physical fractions and measured mass.
دونغهينغ standard lab test sieve shaker illustrates the stacked-sieve arrangement. For background reading, see the non-commercial sieve analysis reference. A useful report brings the sampling record, sieve boundaries, individual masses, percentage definitions, and mass balance together so another reader can understand what was actually tested.
Is material on a 1 mm sieve exactly 1 mm in size?
No. Its fraction is bounded by the sieves above and below it, and particle shape affects passage. The label identifies an opening, not one exact diameter for every retained particle.
Why is the pan included in the calculation?
It collects the material passing the smallest selected opening. Omitting it loses part of the sample and changes the distribution.
Can every powder be tested by dry sieving?
No. Very fine, cohesive, wet, or otherwise unsuitable materials may need a different specified procedure. Choose the method appropriate to the material and question.
Should the recovered fractions equal the starting mass?
They should reconcile within the applicable method's requirements. Investigate a discrepancy instead of automatically hiding it through normalization.
Can a sieve shaker prove that an entire batch is consistent?
It can characterize tested samples. A conclusion about the whole batch also needs a suitable sampling plan and enough representative evidence.